With the new publisher stats from PlugRush you’ll know more about the traffic you’re selling to our advertisers, so you can optimize better.
Publisher statistics with more transparency
In an effort to provide a better overview of the traffic you’re sending us as a publisher, we developed a new overview of these stats with more information and, most importantly, transparency than before. Instead of giving a broad overview as before, our goal with this was to enable you to really see more information about your traffic quality and help you find ways to always improve this quality to get the most out of the visitors you send us.
The new publisher statistics (currently in BETA) can be accessed at SELL TRAFFIC =here.
Available information in the overview
We aim to provide the most relevant info with our statistics for webmasters sending us traffic. The general overview from before is history! You can now break down your publisher stats in millions of ways.
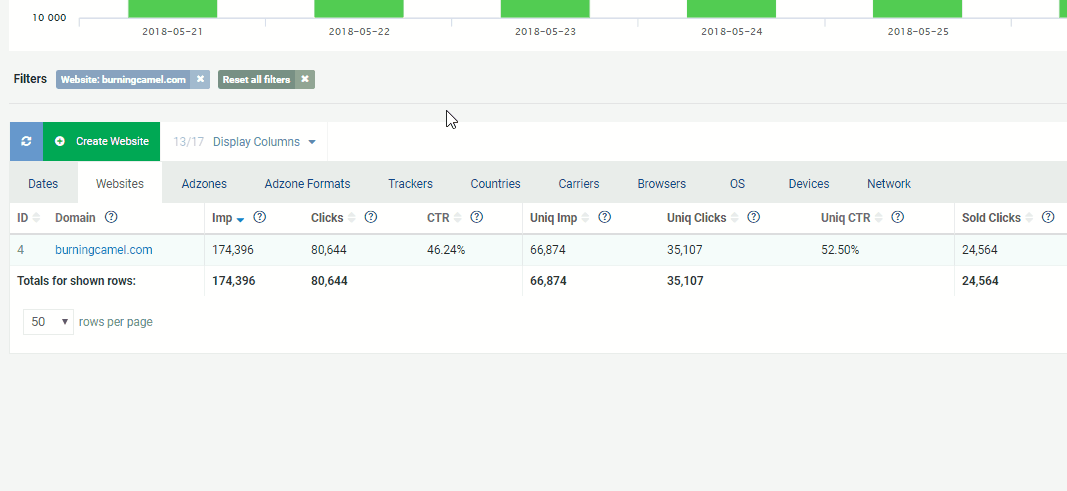
F.ex., if you want to see traffic broken down for pops you sent from Vodafone in Germany, you can do that now… extremely specifically. Just go through the different tabs of the overview and click on the specific things you want to filter by. The filters you apply will appear above the stats overview table and can be cleared individually or reset altogether with one click.
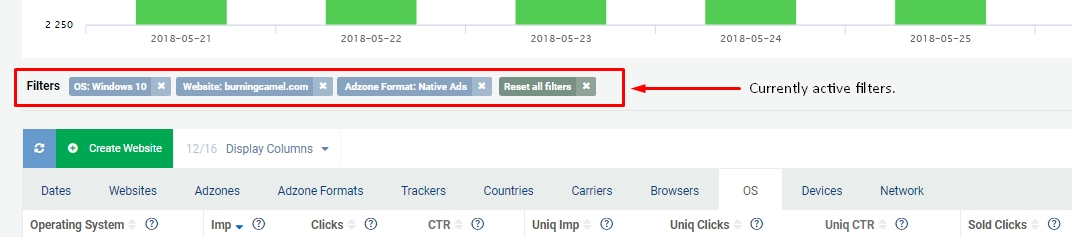
Important note: The overview provided always depends on the top-level breakdown option selected (i.e. Adzones or Countries), the date range applied at the top right of the statistics page, and any specific filters you have applied (which are displayed above the stats overview table).
Pro tip: If you don’t want to see a certain column shown in your stats, you can unselect it from the ‘Display Columns’ dropdown at the top of the stats overview (to the right of the green ‘Create Website’ button).
The following metrics are displayed in the overview table. Here we will provide a thorough explanation of each one to enable you to decide which ones are most important.
Impressions
Here we display raw ad impressions, so how often the ad(s) on your website(s) have been displayed to visitors overall.
Clicks
In this column, raw ad clicks are displayed. This reflects the total number of clicks your adzone(s) generated.
CTR
CTR stands for Click-Through Rate, which shows how often ad(s) on your website(s) are clicked. We display this as a percentage.
Unique Impressions
The amount of unique visitors that were shown ad(s) from PlugRush on your website(s).
Unique Clicks
The number of unique and qualified visitors that clicked on ad(s).
Unique CTR
The Click-Through Rate generated by unique visitors shown ad(s) from us, displayed as a percentage. This is an extremely useful metric when comparing banner and native ads adzones in their effectiveness to generate clicks from unique visitors.
Sold Clicks
The amount of clicks generated that qualified for being sold to our direct advertisers.
Fallback Clicks
Per our quality filters active in the system, these are good clicks we were unable to sell to our direct advertisers. Often, this is either due to a lack of coverage for low demand traffic or because there is a large difference between the amount of raw and unique clicks sent (leaving us unable to monetize all of the raw clicks with direct advertiser demand). Fallback traffic is either sent to the return URL provided by you or it may be monetized on a performance basis. Fallback is displayed as a percentage of total clicks sent.
Bot Clicks
Fraudulent and/or bot-generated clicks that did not pass our currently active quality filters in the system. Bot clicks are displayed as a percentage of total clicks sent.
Revenue
Income generated by the traffic shown.
eCPM
The effective cost per thousand impressions reflects how much you’re earning per 1000 ad impressions.
RPM
Rate per thousand clicks is a metric that shows you how much you’re earning per 1000 ad clicks.
Top-level breakdown options
Beyond selecting the date range at the top right of the publisher stats, you can also choose from a variety of top-level breakdown options. This allows you to see statistics for your sold traffic broken down in a way that allows you to analyze it in the most efficient manner possible. For example, you can view your stats broken down by countries or even mobile carriers. The tab names of these are fairly self-explanatory, i.e. the ‘Adzones’ tab will display your publisher stats broken down by your adzones, so we won’t go into more detail on those.
Once you’ve selected a tab at the top (i.e. countries), you can additionally filter by something more specific beyond that (i.e. Australia). Then, if you switch away from this tab to… let’s say the dates tab, you will still only see traffic from Australia broken down by dates. At least until you clear the filter for Australia at the top. That means you can get statistics for very specific traffic you’ve sent in great detail, which in turn will allow you to optimize what traffic you send us much more precisely.
Pull publisher stats with our powerful API
While our publisher stats overview is completely awesome, we understand that some publishers may have the desire to retrieve their stats via API. This is definitely possible as a PlugRush publisher. You can obtain your API token here and our API documentation is available here.
Thank you for reading
We hope this quick guide to using our publisher statistics overview has been helpful to you. If you have some unanswered questions left, hit up our support team.


