Our new statistics system for publishers is an amazing optimization tool for all webmasters sending visitors into our traffic network with their sites. Break down stats on multiple metrics for maximum efficiency.

Very recently, we published a guide about our new publisher statistics system that’s currently in BETA. One of the key features of this new system is the ability to break down your websites traffic stats on multiple levels to really pinpoint where your best performing visitors are coming from. In this article, we’ll cover how to use this very powerful feature, just in case you’re finding yourself a bit lost trying to use all the sweet new technology we keep coming out with!
The #1 reason to build a new stats system for our publishers was…
You may ask yourself why we went through all the trouble of creating a brand new way to look at publisher stats. And I’m going to tell you why: Because it’s extremely useful to know where your best performing traffic is coming from exactly.
Let’s say you send traffic from a variety of countries, operating systems, browsers, carriers, and so on. This is the reality for most website owners sending traffic to our advertisers. If you can only break down your statistics on one of these important metrics at a time, you will most definitely find it rather difficult to pinpoint exactly where the best visitors are coming from.
Horror scenario with the old stats: You’re reviewing the stats for your websites and want to know what kind of traffic you should send us more of. You can break down by countries OR by operating systems, but not both at the same time. So you might know which country performs best and which operating system performs best individually, but you’d never know which country and operating system combination is definitely the best.
The above is just one example, there are many more. But not to worry, PlugRush has you covered. We asked ourselves, “What kind of stats breakdowns do publishers want to have ideally?” Then we additionally asked a ton of webmasters in our network this same question. And the answer was generally the same: Everyone agreed that we need…
Stats broken down on several metrics simultaneously for maximum efficiency
After we arrived at this conclusion, we quickly and very politely asked our developers to type away furiously and come up with a sweet new statistics interface that would blow our publishers away. And they did just that.
The key focus of the new stats system is more transparency and better breakdown options. You get more information and you’re able to break it down in a way that pinpoints exactly what traffic you need to be sending more of and also which traffic we aren’t able to monetize that well for you. The latter is just as important as knowing the former.
How to easily break down your publisher statistics on multiple metrics very quickly
The GIF below illustrates how you can select multiple metrics at once to pinpoint very specific visitors you’re sending us. A simultaneous breakdown of website, adzone, country, carrier, and operating system is produced in just a few clicks on the stats index. The possibilities are truly endless with this new system.
Removing selected metrics from the breakdown filters
Above, I showed you how to break down your stats in multiple ways at the same time. If you end up overdoing it a little bit, don’t panic and reload the page. You can undo individual filters you’ve applied with just a click. I’ll show you how in the animated GIF below.
Pinpointing your best traffic is quick & easy
As you’ve probably noticed by now, finding out where your best performing traffic comes from is no longer a difficult task. It’s actually a very easy task that doesn’t take a lot of time. So make sure you analyze the traffic you’re sending us with your websites regularly and do your best to send us the most productive visitors possible. It’ll put more money in your account balance for withdrawing and make our advertisers extra happy too!
Finding traffic you should send more of
Let’s go through finding good traffic, which you should ideally send us more of, step by step with an example. First, you would break down by the site and adzone you’d like to optimize. For this example, we’ll use a native ads adzone.
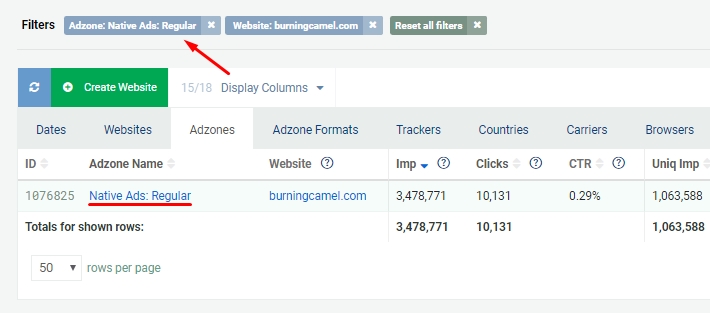
Next, we’ll decide on the next metric to filter by. We’ll use countries, but you can use any metric you believe is most important first. So we’d go to the ‘Countries’ tab and select the country where we have the best performance. Generally speaking, the eCPM (how much you’re earning per 1000 visitors to your site) is a reliable metric to use in order to pinpoint best performance.
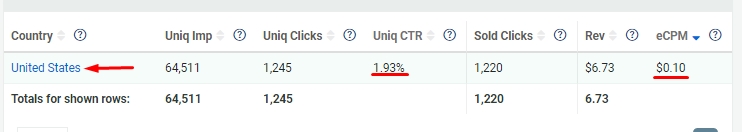
So in this example, we chose United States as our next breakdown, because the Click-through Rate (CTR) is overall good and the eCPM exceeded that of other countries.
Next, we’d move to the ‘Carriers’ tab and make a selection there, again based on the eCPM being achieved. It’s also advisable to factor in other data into your decision, f.ex. if a certain breakdown reveals that one country, carrier, etc. is achieving a bot percentage over 30% it may certainly be a good idea to try sending less of that traffic. (Or find better ways to filter out bot traffic before sending traffic.)
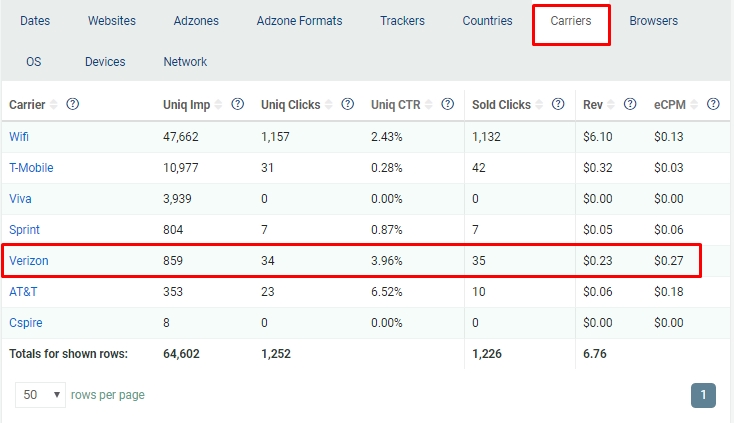
As you can see above, Verizon is performing best for this example. So it’s becoming clear that sending more traffic from the Verizon carrier in the USA could benefit the publisher’s numbers. Next, we could go to the other tabs of the stats index and locate even more specific traffic, but for the sake of providing a simple example we’ll stop here.
Note: For illustrative purposes, the above screenshots are only showing certain stats columns. This makes them easier to read. You can of course leave all stats columns intact when analyzing stats yourself.
Pro Tip: Always, ALWAYS, send banner traffic. Our advertisers will love you for it. If you’re a webmaster with us and you don’t have some banners from PlugRush on your website, you’re not using our service to its full potential. Go make a banner adzone right now.
Indications that you should reduce certain traffic
Now that you’re a pro when it comes to breaking down your publisher stats, we’d like to give some rough guidelines on when you should reduce certain traffic you’re sending us, provided this is a possibility for you. If you’re unable to optimize traffic in this way, stick to finding the best performing traffic as outlined above, and see to it that you send us more of that! Sending more of the good stuff is far more important than sending less traffic that doesn’t perform that well.
Reducing traffic may be recommended when a specific breakdown meets one or several of the following requirements:
- A bot percentage over 30%. Filters to reduce bot traffic would be ideal, otherwise it may make sense to reduce traffic for the specific breakdown. (Try to pinpoint where the bot traffic is coming from precisely using all tabs of the new publisher stats.)
- A percentage of fallback above 50%. This indicates too many repeat visitors are being sent and we’re unable to monetize them efficiently multiple times. Trying to send us unique visitors only once would be a good goal here.
- For display adzones (i.e. banners or native ads), if the unique CTR is much lower than 0.30% it’s generally a good idea to look into a reduction of this traffic.
- After selecting the best performing traffic on 3-4 breakdowns, you’re seeing that certain visitors just don’t perform that well and continuously achieve a much lower eCPM than others. Of course it may be a good idea to exclude them at this point.
Thanks for reading!
Please check out our guides to learn more about how to use PlugRush or contact our helpful support team if you have some specific questions on your mind.


